 Lainbo's Blog
域名邮箱转到Gmail被丢垃圾邮件?来试试用Telegram Bot接收域名邮件吧
使用 Cloudflare Email Routing 转发域名邮件到 Gmail 时,重要邮件被误判垃圾邮件的问题困扰了许多人。本文介绍了一个简单有效的解决方案:通过 mail2telegram 项目,利用 Cloudflare Workers 和 Telegram Bot 直接接收邮件,绕过 Gmail 垃圾邮件过滤
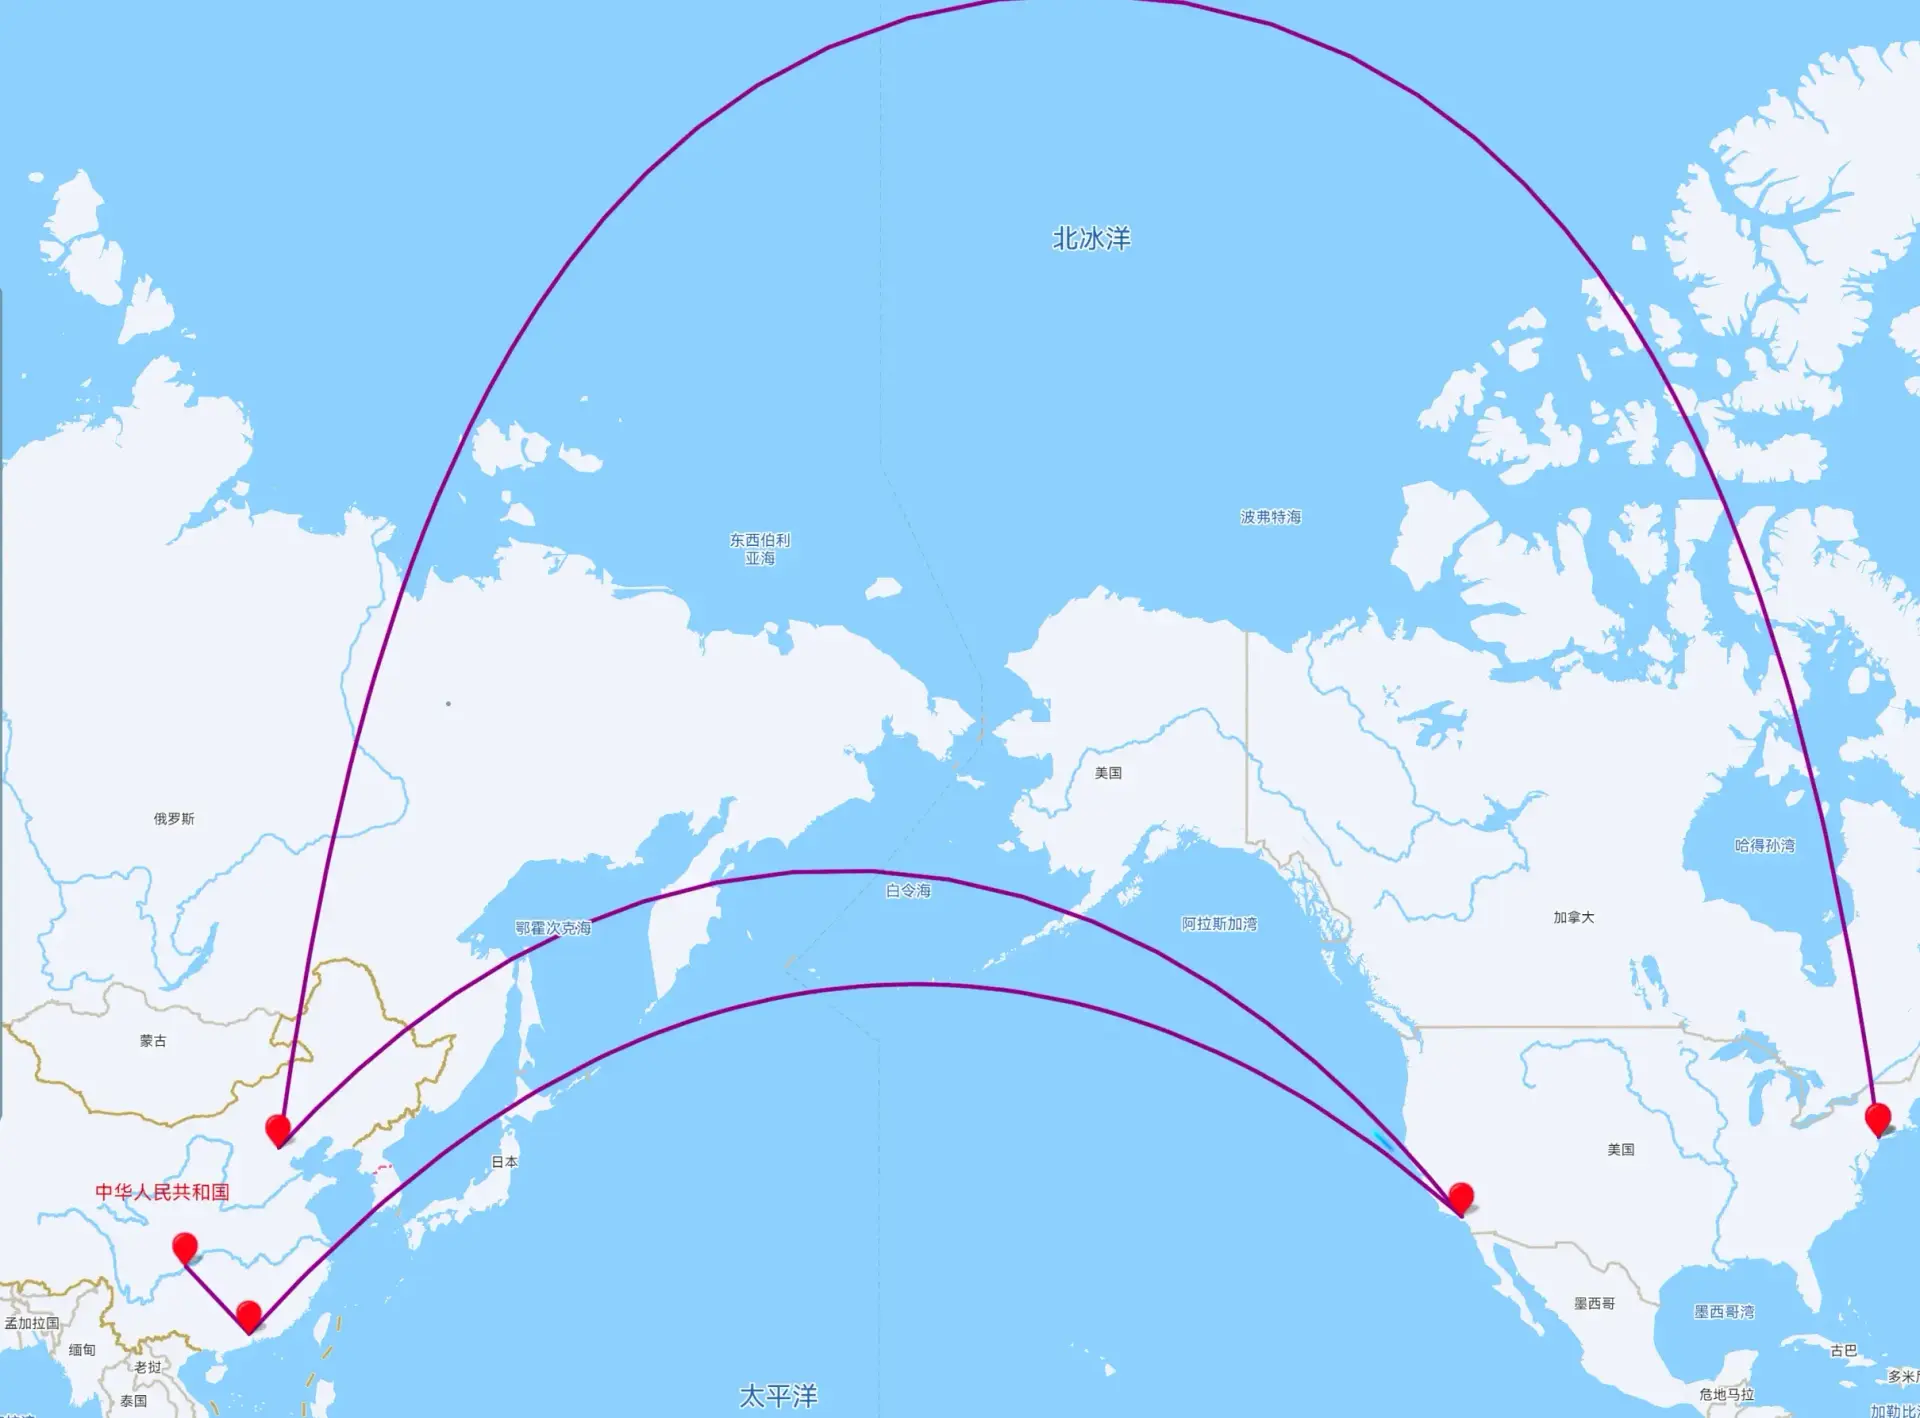
Alist 事件后,我如何用 Deno 解决 Koofr WebDAV 在国内的访问难题

我平时用自建Alist作为webdav的使用,最近的风波让我转向使用koofr,可是远在欧洲的服务器让同步困难,于是……

中银香港汇丰办卡开户行程及攻略

办理港卡需要的前期准备的证明材料、银行预约技巧,到实地办理汇丰和中银香港账户的详细过程。介绍了路线规划、虚拟银行开户等实用信息,希望能帮助大家顺利完成香港开户
Obsidian使用Cloudflare R2(S3兼容)在多个设备同步

随着Notion对俄罗斯用户的制裁,我意识到即使在多个服务商做了备份,在线文档永远是一把悬在头上的达摩克利斯之剑,孟子说君子不立危墙,不行陌路,不入深水,不坐垂堂。那我今天就来研究一下Local first的文档应用吧~
《The Almanack of Naval Ravikant(纳尔瓦宝典)》TL;DR

致富不是靠运气,幸福也不是从天而降的。积累财富和幸福生活是我们可以学习的技能。 这本书收集整理了硅谷投资人纳瓦尔在过去十年里通过推特、播客和采访等方式分享的人生智慧,向读者分享了纳瓦尔关于财富积累和幸福人生的原则与方法。纳瓦尔不仅告诉读者怎样致富,他还告诉读者怎样看待人生,怎样获得幸福,他对财富、人生的思考将帮助你走自己独特的道路,过上更富有、更幸福的生活。
《Ultralearning(超学习)》TL;DR

这是《Ultralearning》的太长不看版本。你能在一年内学完获得大学学位所需的全部课程吗?能在几个月内精通一门新语言吗?能同时掌握多种专业技能吗?——这些,都是超学习完成的壮举。
《影响力:说服心理学》TL;DR
这是《影响力:说服心理学》的太长不看版本,这本书自出版以来,就一直是畅销佳作。由于它的影响,说服得以成为一门科学。无论你是普通人还是为某一产品或事业观点游说的人,这都是一本基本的必读书,是你理解他人心理的基石
在Windows中,搜狗输入法输出直角引号「」的优雅方式
找了很多Windows下如何输入直角引号的方式,基本都是基于一些类似于宏的操作,比如AHK,或者自定义短语,本身介绍了一种可以真正利用搜狗原生输入符号能力做到的方式